


Quickly identify integration issues, understand what happened, and take action faster
Use Integration Overview to monitor integration activity and investigate issues across your Beeline Enterprise integrations. From a single dashboard, you can review processing activity, identify failures, and access troubleshooting details for flat-file integrations, reports, Import Batch APIs, client APIs, and webhooks, so you can quickly understand what happened and determine your next steps.
Jump to what you want
Why it matters
- Integration issues can prevent data from moving between Enterprise and connected systems.
- Processing failures can delay business processes such as onboarding, reporting, invoicing, and approvals.
- Investigating issues takes longer when integration activity and errors are spread across multiple tools.
- Faster visibility into failures helps reduce disruption and improve operational efficiency.
Who it's for
- Program office users
- System admins
How it helps
- Gives you a single dashboard for monitoring integration activity.
- Brings file, reporting, API, and webhook information together in one place.
- Highlights failed jobs, API errors, and webhook delivery issues that may require attention.
- Provides detailed processing and error information to support troubleshooting.
- Helps you identify the source and scope of integration issues more quickly.
Availability and setup
- The Integration Services feature must be enabled for your organization.
- Access to the Integration Overview dashboard requires a Service Request so the appropriate permissions can be granted.
- Available dashboard components depend on your organization's enabled integrations and services.
- Webhook delivery visibility is available only when webhook integrations are configured and active.
Before you begin
- Verify that you can access Integration Services.
- Verify that you can access Integration Overview.
- If you are investigating an issue, identify the integration job, file transfer, API request, report, or webhook event you want to review.
Information in this article reflects a standard Enterprise configuration. Your Enterprise platform is based on your organization’s configuration. Settings and/or data visibility rules may vary slightly from what is described.
Access Integration Overview
- From the Navigation menu, select Preferences > VMS Settings > Integration Services.
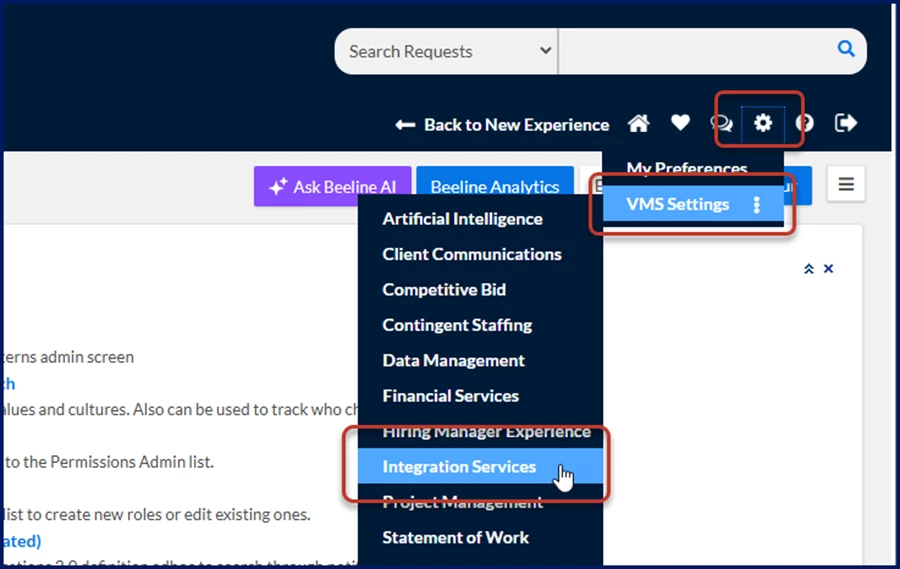
The Integration Services page displays.
- Optional. Select Beeline Developers portal to quickly access Enterprise APIs.
- Select Integration Overview to access the Integration Overview dashboard.
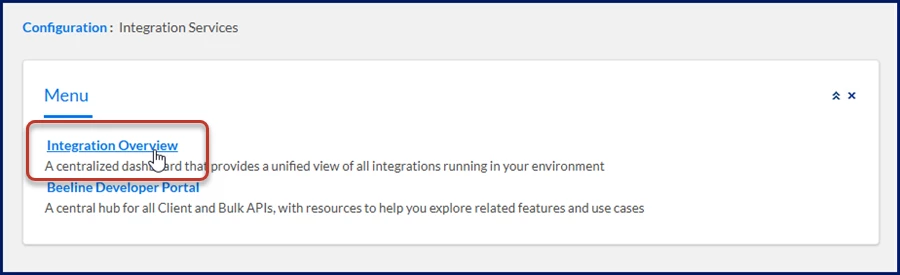
The Integration Overview dashboard displays.
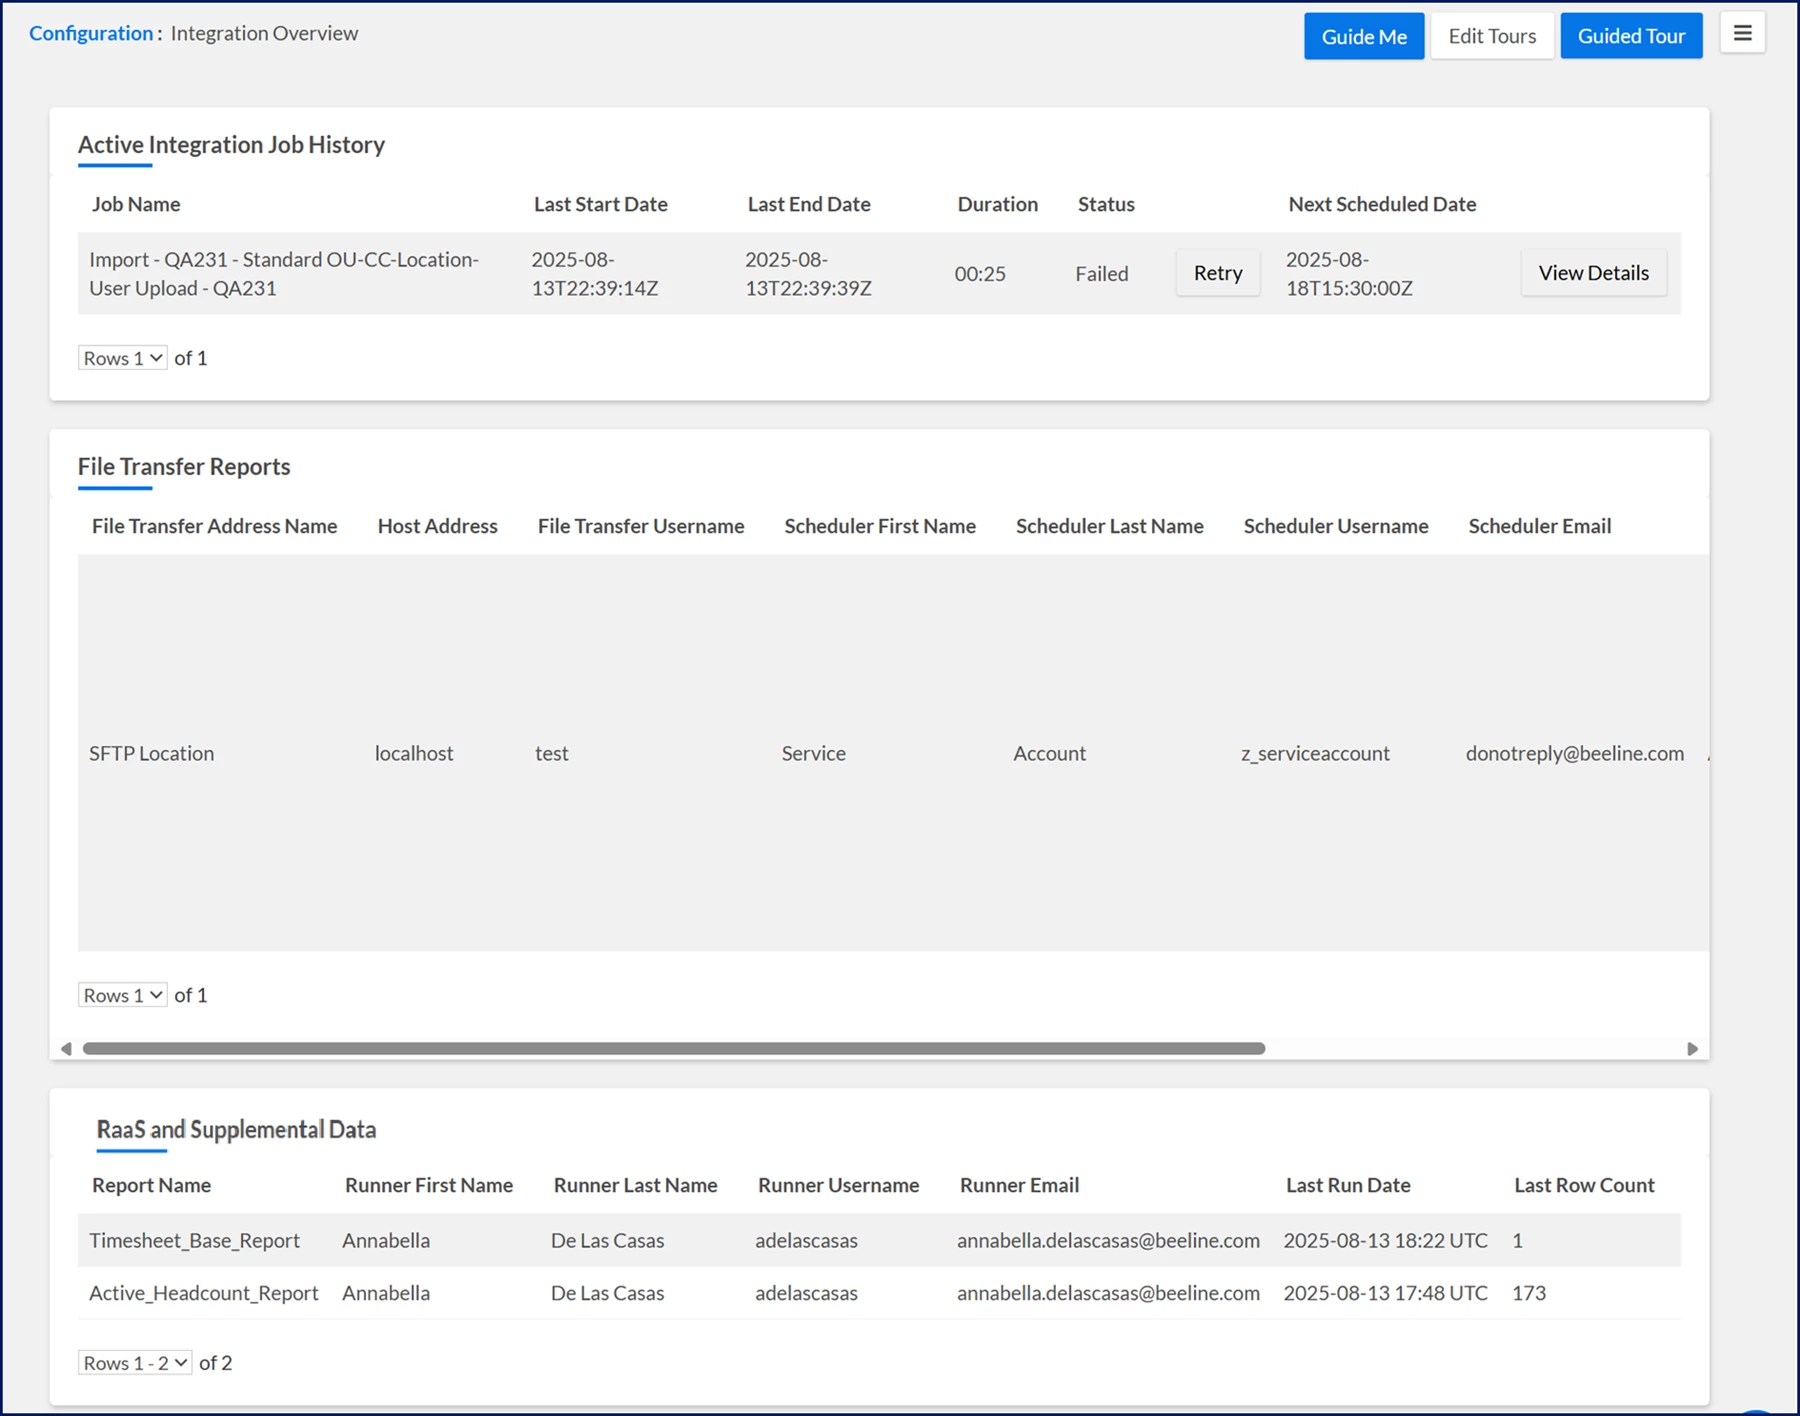
Based on the data that displays, take any of the following steps.
Review integration job activity
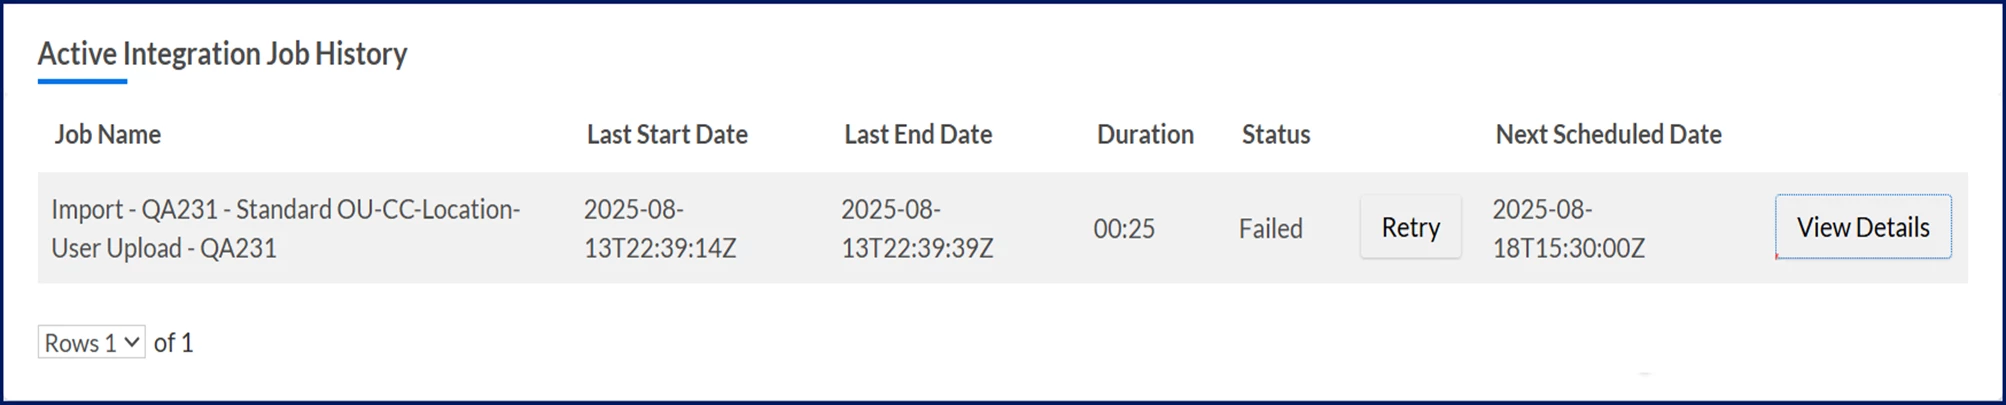
Use Active Integration Job History when you need to review recent integration processing activity or investigate a failed integration job.
- In the Active Integration Job History section, locate the integration job you want to investigate.
- Select View Details. Processing details for the selected job display.
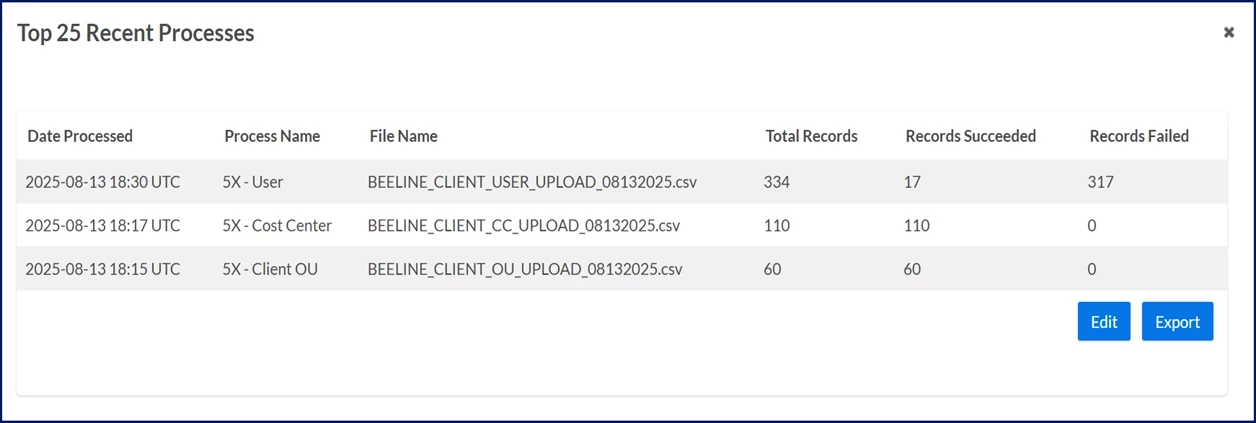
What this does: Helps you review recent integration activity and processing results.
Why this matters: You can quickly identify unsuccessful jobs and investigate processing issues before they affect downstream activities.
-
Review available status information and processing results.
-
From there, you take one of these actions:
- Select Export to transfer the data to a .xls type file.
OR
- Select Edit to change the columns that display in the dialog.
- If an integration job was unsuccessful, select Retry to rerun the job.
Result
You can determine whether the integration completed successfully and identify jobs that may require corrective action.
Check flat file processing status
Use File Transfer Reports when you need to verify flat file processing activity or investigate file transfer issues.
- Locate the File Transfer Reports section.
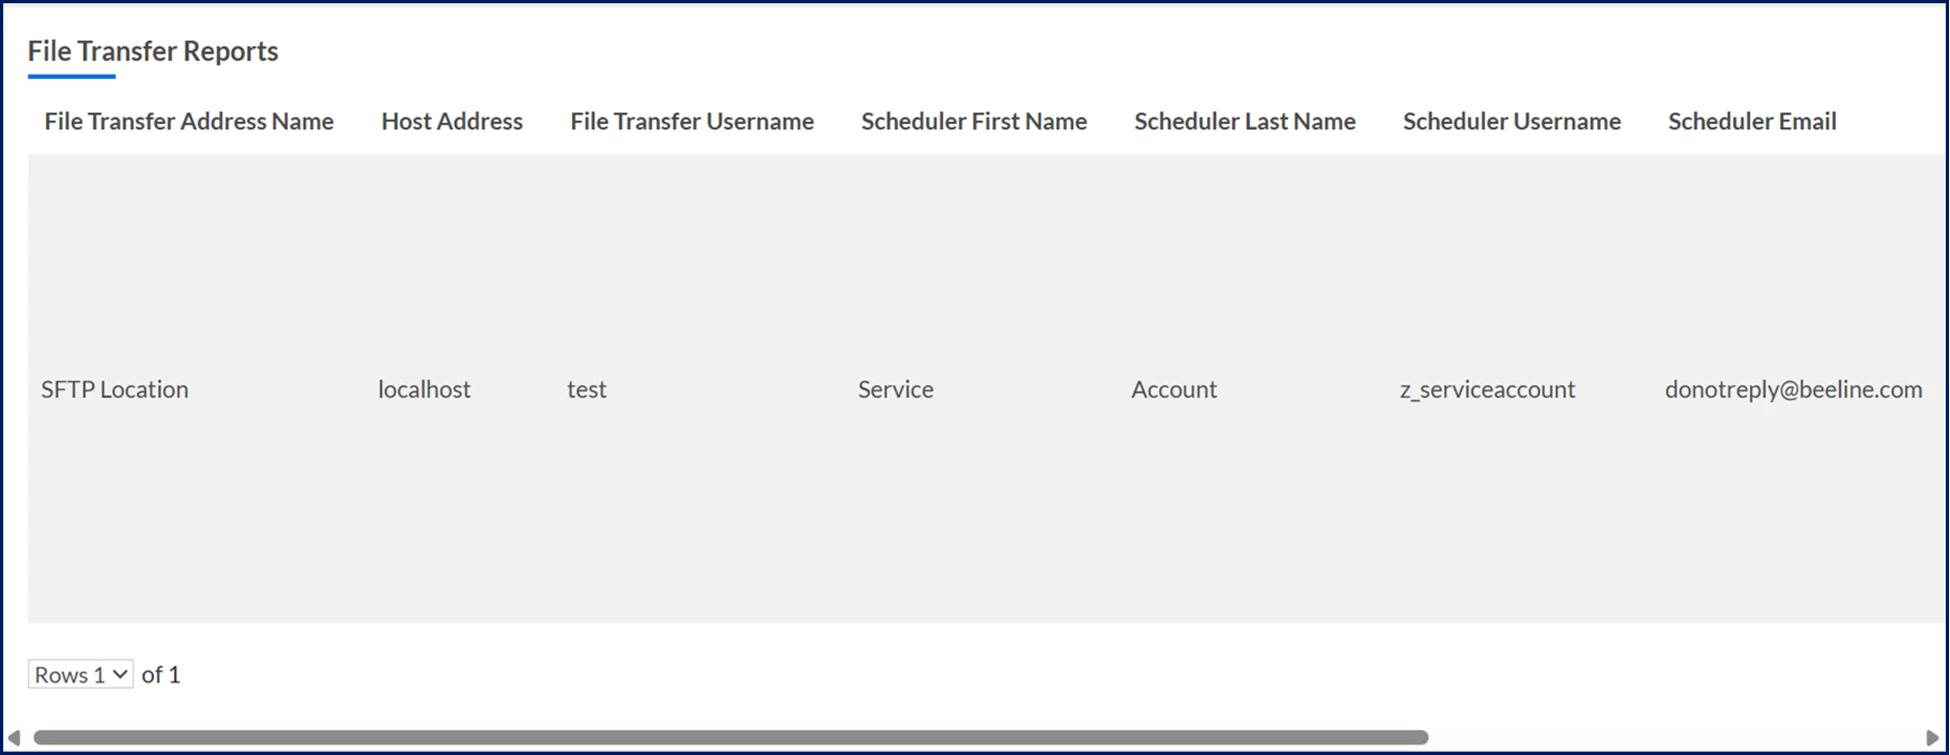
- Review the status of the flat file integration.
- Review the most recent scheduled run information.
- Review the upcoming scheduled run information.
What this does: Helps you monitor flat file integration processing and scheduling activity.
Why this matters: You can confirm that flat-file integrations are running as expected and identify issues that may disrupt data exchange. - Compare the reported activity with your expected file processing schedule.
Result
You can confirm whether flat file integrations processed successfully and identify integrations that may require additional investigation.
Review reporting and supplemental data activity
Use RaaS and Supplemental Data when you need to verify reporting activity or review Supplemental Data API requests.
- Locate the RaaS and Supplemental Data section.
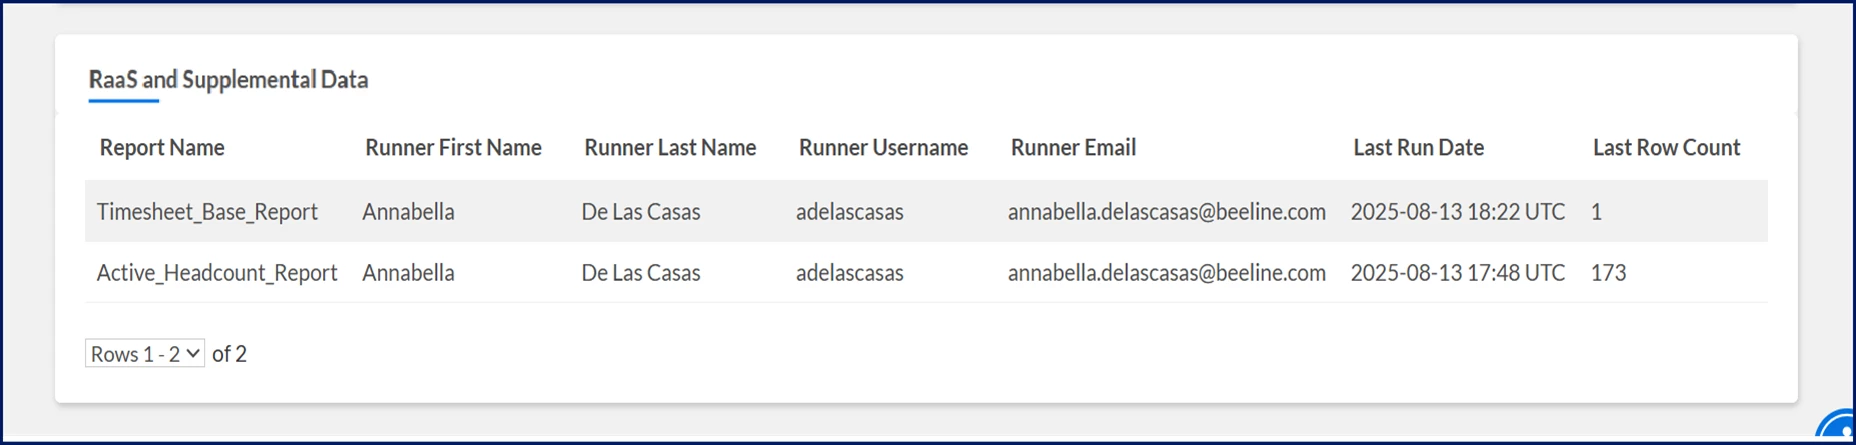
- Review recently executed Reporting as a Service (RaaS) requests.
- Review recent Supplemental Data API activity.
What this does: Helps you monitor reporting activity and supplemental data requests.
Why this matters: You can verify that reporting and supplemental data processes are completing successfully and identify activity that may require further investigation. - Compare the displayed activity with the reports or supplemental data requests you expected to run.
Result
You can confirm that reports and supplemental data requests were processed successfully or identify activity that requires follow-up.
Review Import Batch API activity
Use Client Bulk APIs when you need to review Import Batch API activity and identify processing issues.
- Locate the Client Bulk APIs section.
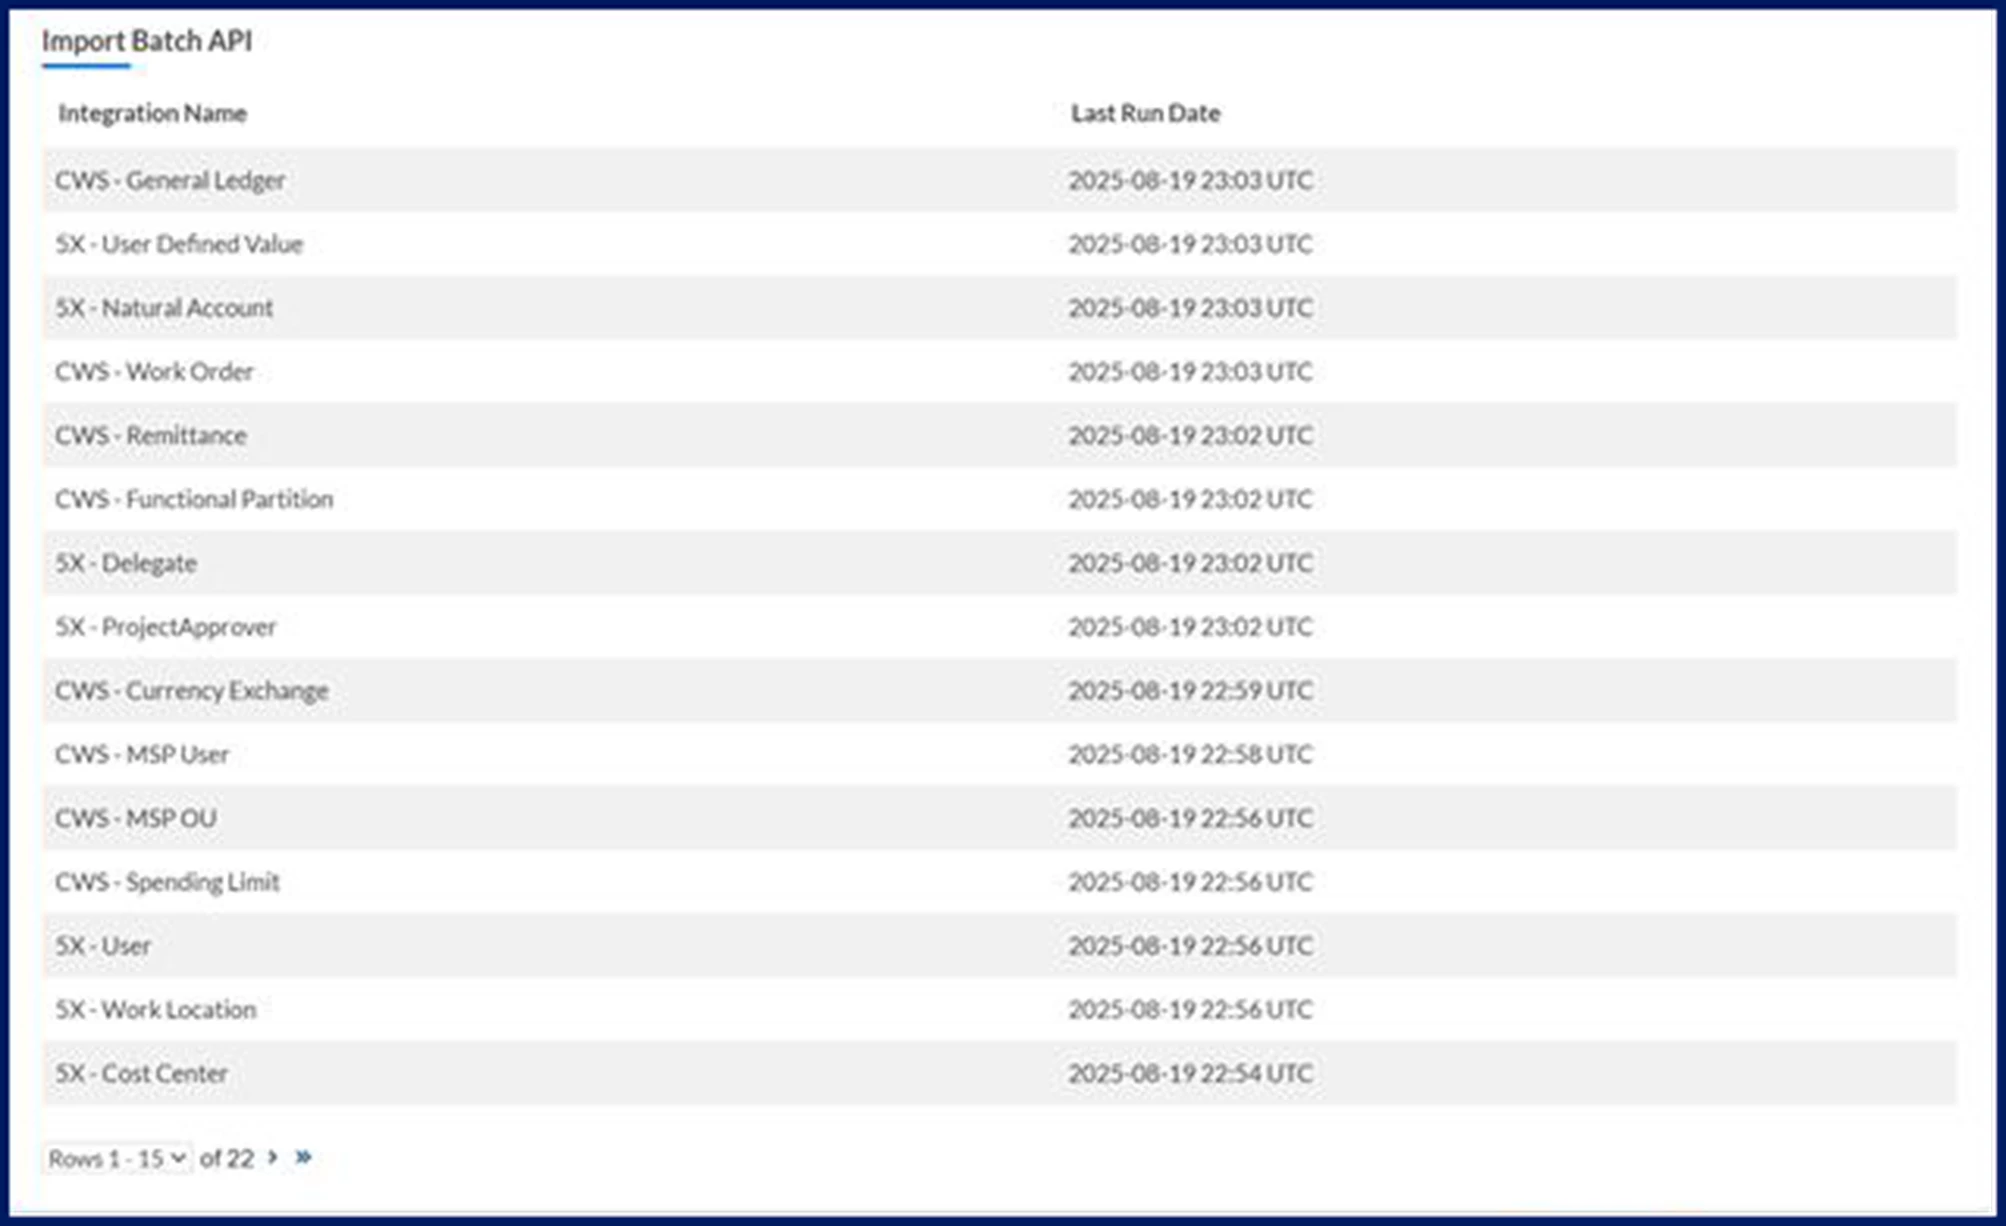
- Review the available import jobs.
- Review the last run date for each job.
What this does: Helps you monitor Import Batch API processing activity.
Why this matters: You can quickly identify imports that may not have processed as expected and determine whether additional investigation is needed. - Compare processing activity against expected import schedules and data updates.
Result
You can verify that import jobs ran successfully and identify jobs that may have contributed to data synchronization issues.
Analyze API failures
Use Client API Error Codes when you need to investigate unsuccessful API requests.
- Locate the Client API Error Codes section.
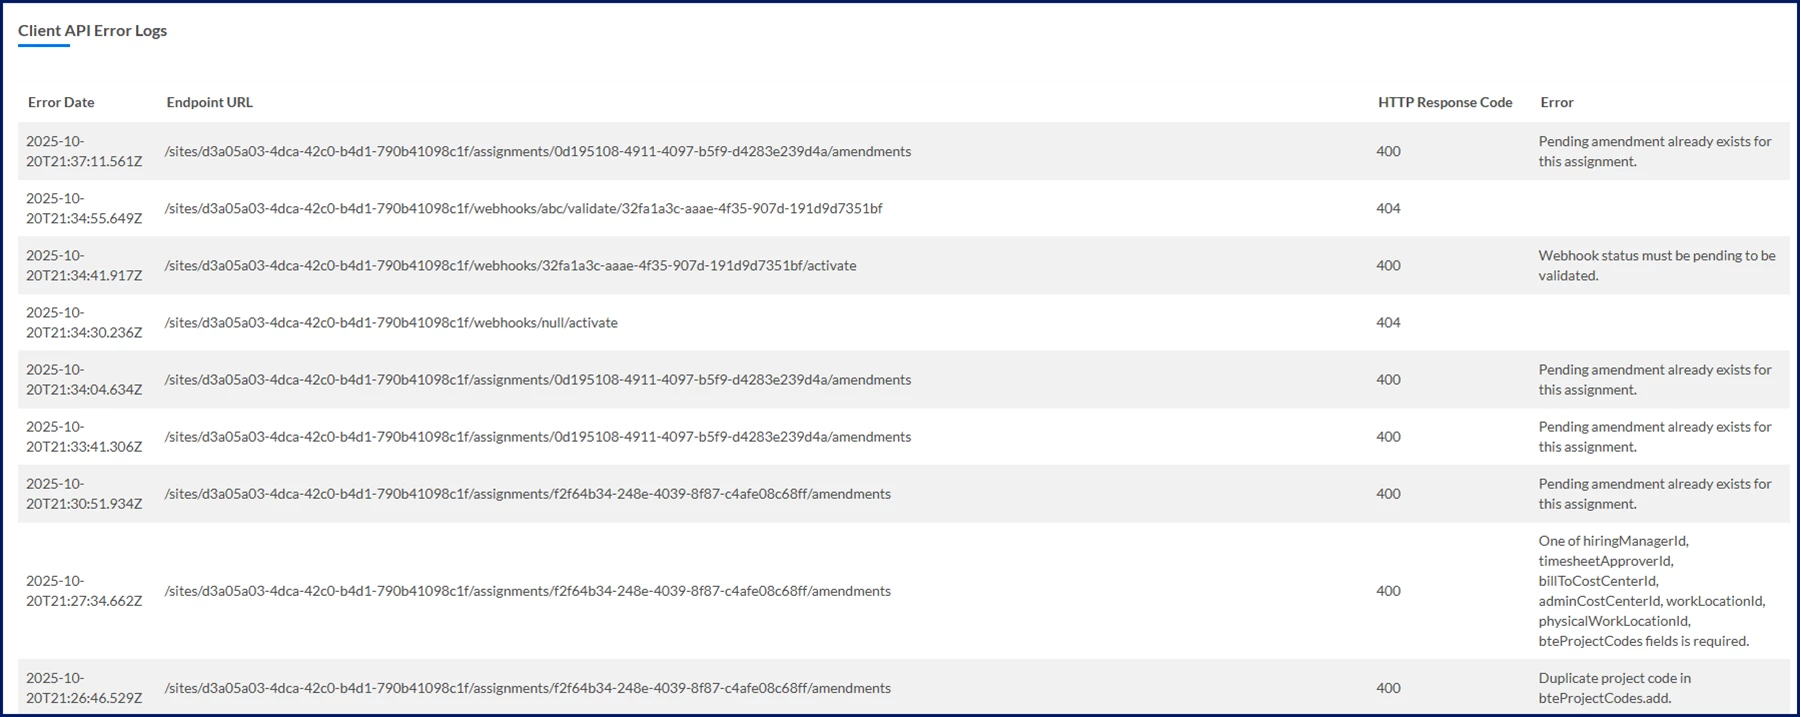
- Identify the failed API request.
- Review the available error information:
- Date the error occurred
- Invoked endpoint
- HTTP response code
- Error message
What this does: Helps you identify failed API requests and review the details needed to understand what went wrong.
Why this matters: You can quickly determine the source of an API issue and identify any required corrective action.
- Use the endpoint, response code, and error message information to continue troubleshooting.
Result
You can identify the affected endpoint, understand the reported error, and determine the next steps for troubleshooting.
Troubleshoot webhook delivery failures
Use Failed Webhook Deliveries when you need to investigate webhook events that were not successfully delivered.
- Locate the Failed Webhook Deliveries section.
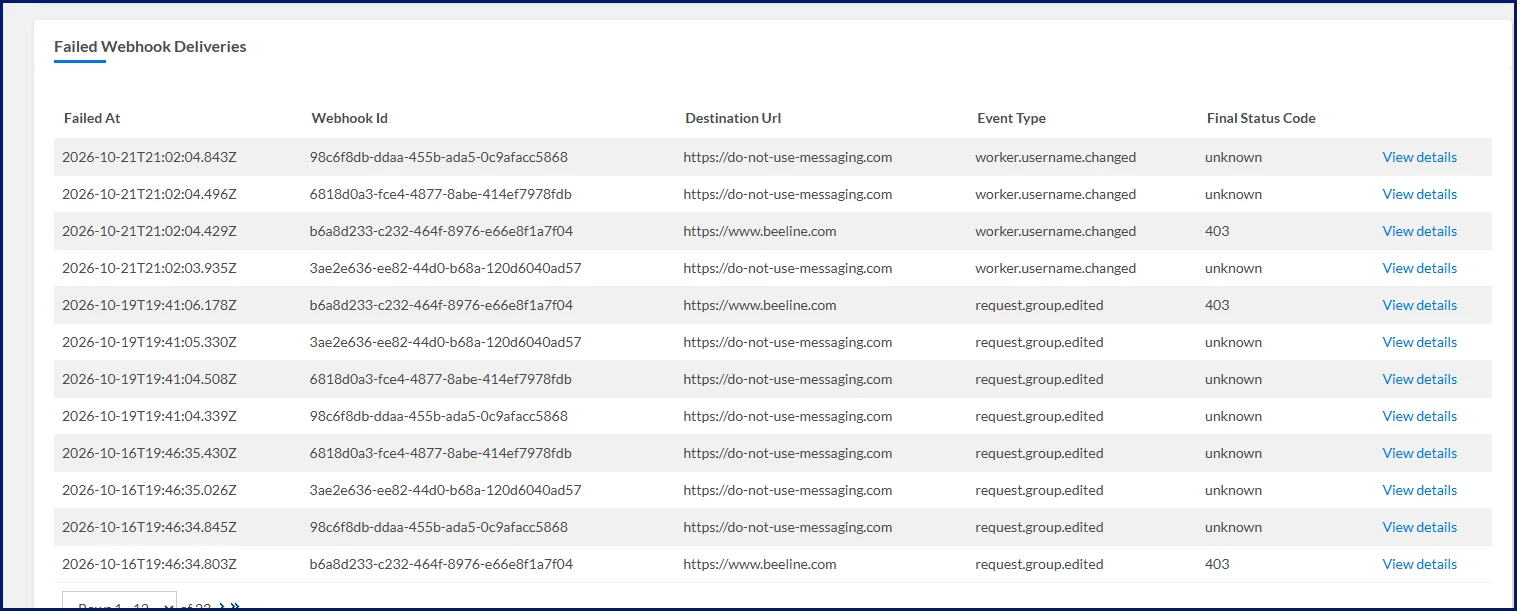
- Identify the failed webhook event.
- Review the available information:
- Failed date and time
- Webhook ID
- Destination URL
- Event type
- Final status code
What this does: Helps you identify webhook events that could not be delivered successfully after all retry attempts were exhausted.
Why this matters: You can quickly determine whether connected systems may have missed important updates and begin investigating the cause of the failure.
- Select View Details. The webhook details window displays.
- Review the available troubleshooting information.
Review this information To help determine Event payload What data was sent Delivery attempt history How delivery progressed over time Response codes How the destination endpoint responded Error messages Why delivery attempts failed Destination URL The endpoint URL in your system that receives webhook requests from Beeline.
- Use the delivery history and error information to identify issues related to endpoint availability, configuration, authentication, or connectivity.
Result
You can identify the failed webhook event, understand why delivery failed, and determine whether endpoint or connectivity issues require further investigation. If an event fails, you can use the identifiers in the payload to find the affected record and complete any missed processing.
Next steps
After you identify the source of the issue, use the information you gathered to determine the appropriate next step, such as rerunning a job, validating an endpoint configuration, contacting a connected system owner, or engaging your implementation or support team. Continue monitoring the Integration Overview dashboard to confirm that the issue has been resolved.
| Persona System admins | Modules Authentication & data exchange | Documentation release Beeline Enterprise | Q4 2026 | Feedback? Email us: |