


Table of Contents
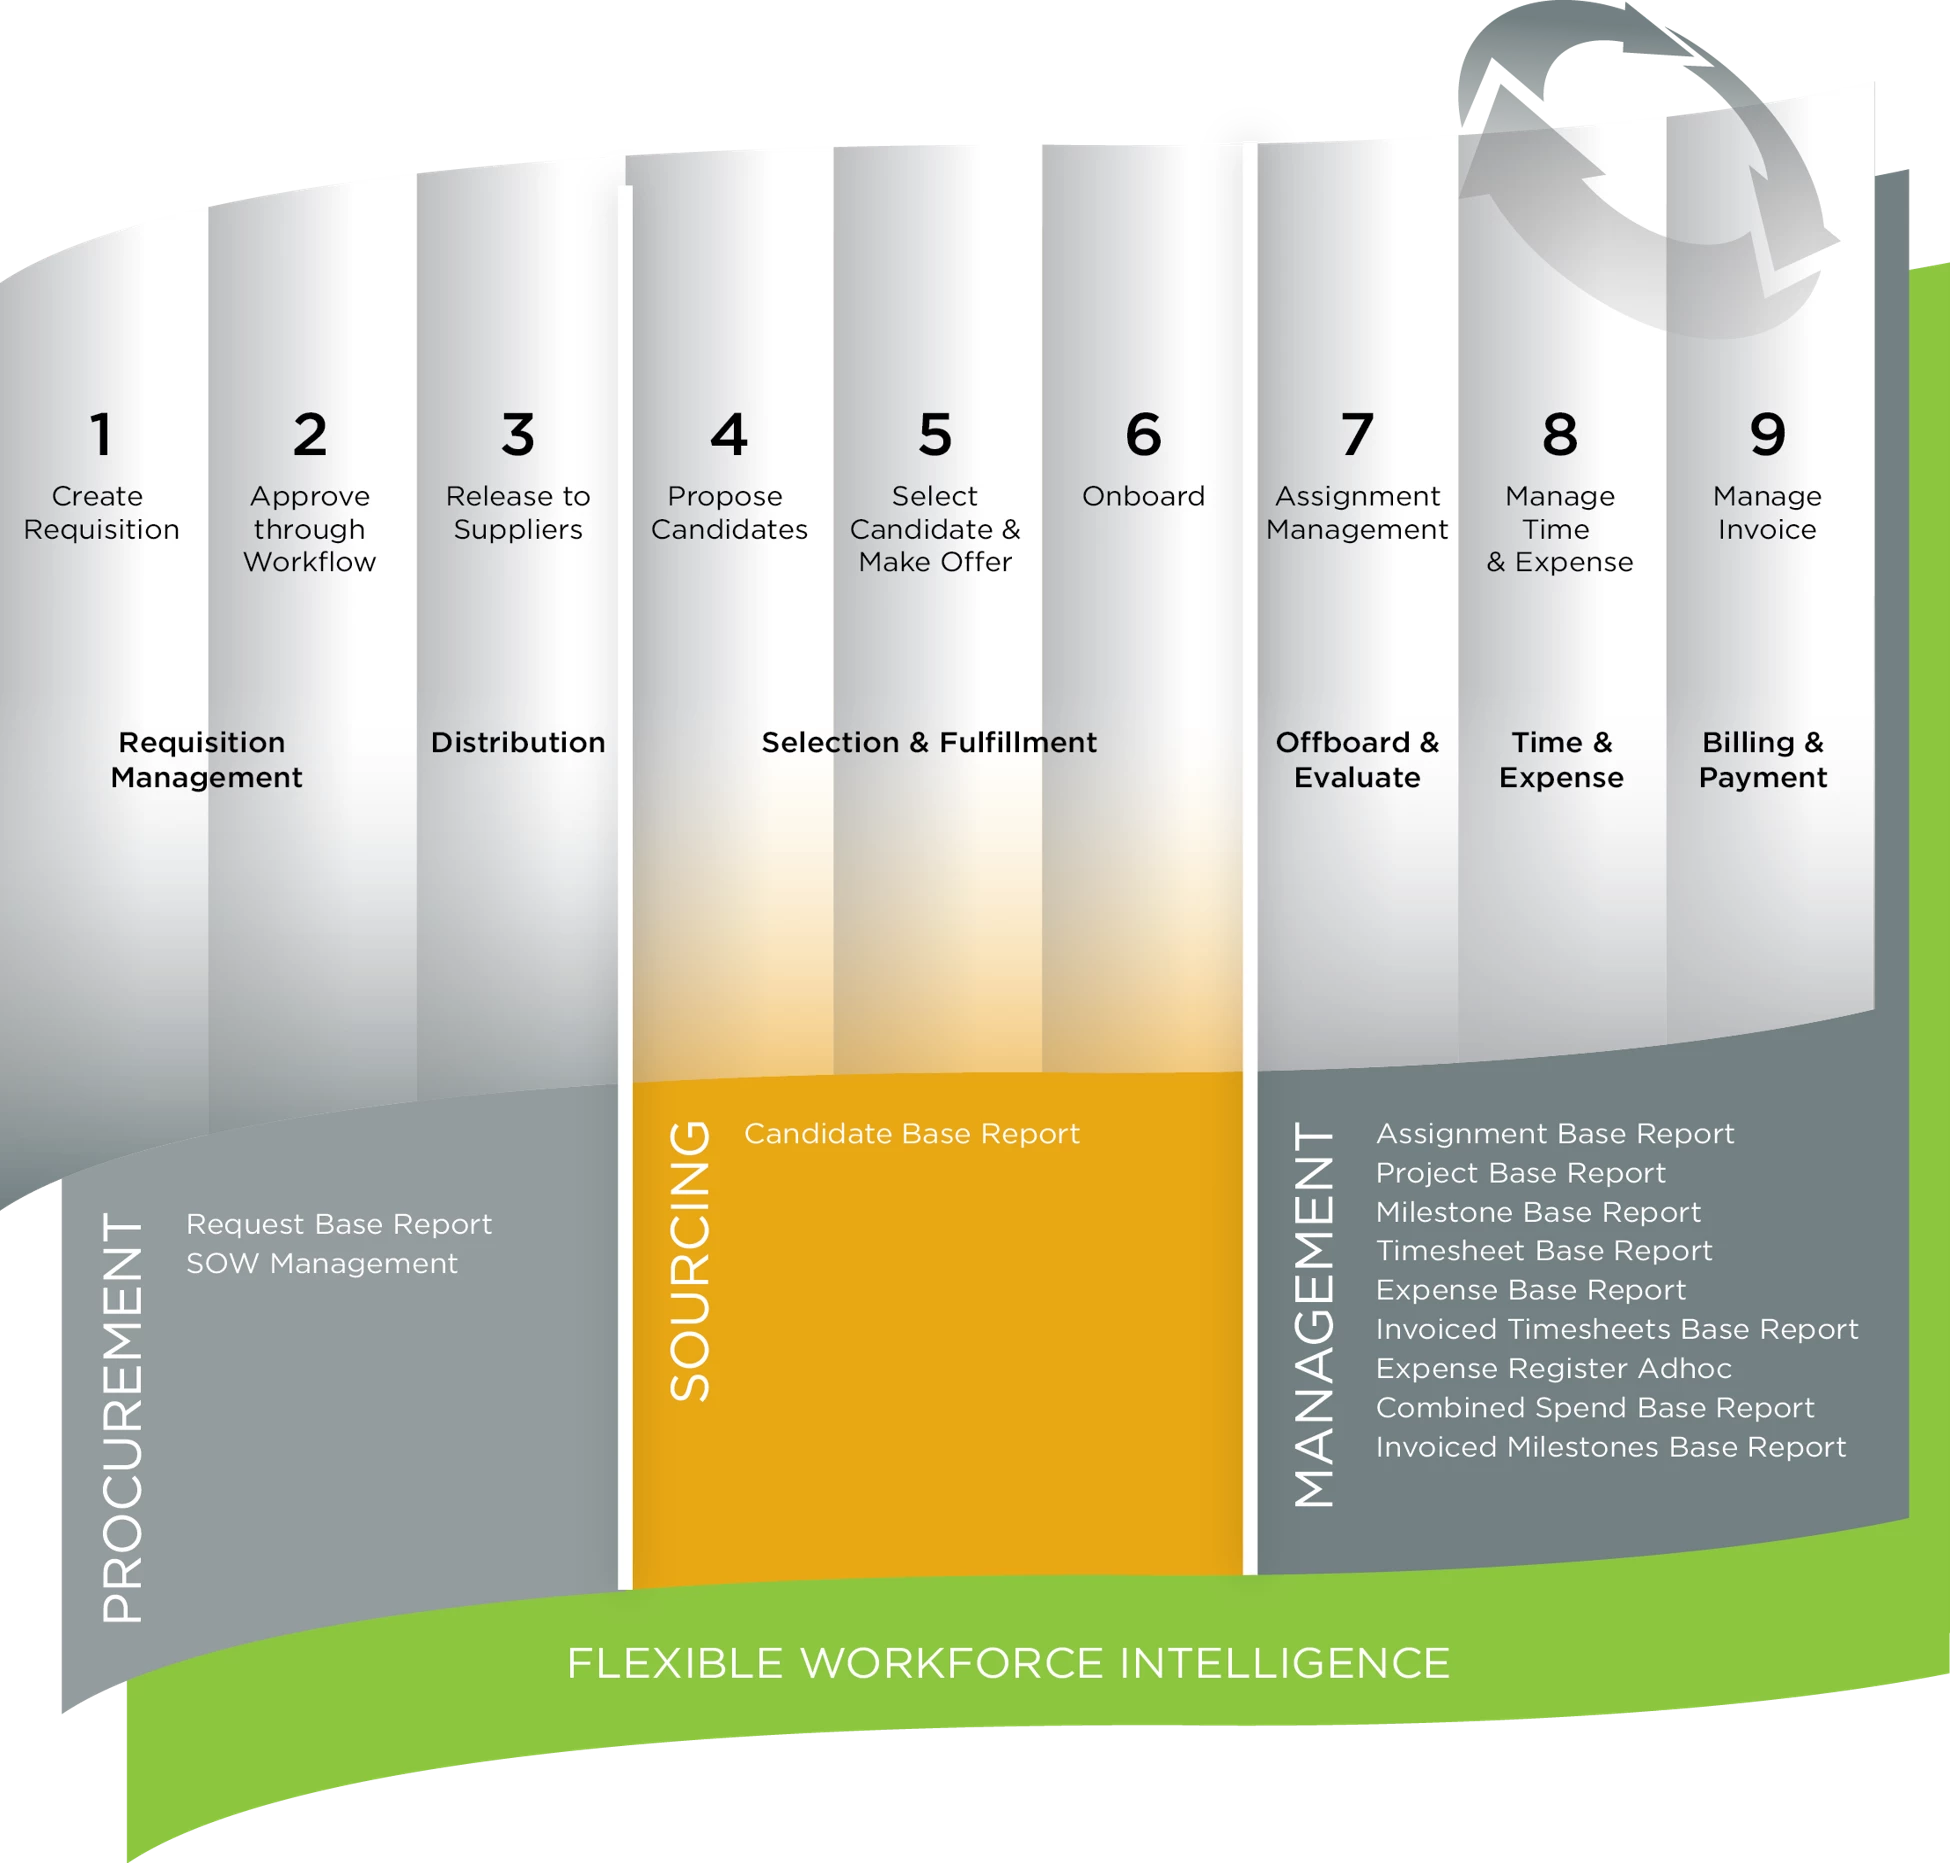
Beeline Enterprise is a “data driven” application. Throughout the various workflows data is generated, organized, and stored. This data not only supports the overall Beeline Enterprise Lifecycle, but it also provides the foundation for our robust reporting capabilities for both standard and analytics reporting.
Beeline Enterprise Lifecycle
Reporting Basics
♦ Definitions, Base Reports, Instances
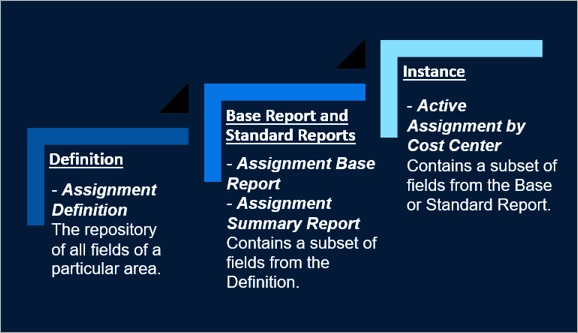
A report Definition provides the foundation from which all Beeline Enterprise Base Reports are built. Each Definition indicates which fields can be used in any specific Base Report. In turn, Base Reports provide the foundation from which all Instance Reports are created. Together, this combination of “definition”, “base”, and “instance” provide a powerhouse of reporting capability.
♦ Gather Requirements
How does a Program Office effectively decipher the clients need for reporting and facilitate a clear response? You’ll often, find yourselves encountering some difficulties when assisting the client with reporting. First, you’ll need to make sure that you have all the information. Capturing data and allowing the end user to report on it is one of Beeline Enterprise’s greatest strengths; but you’ll need to know the right questions to ask up front. Listed below are business and technical questions that can be helpful to use for this process.
Technical Questions – these questions focus on the formats used in the report and how the final report output should look.
- How should the report look? Do you want it formatted, list, data only, Excel®, or a chart report?
- What fields should be included in the report?
- What should the column label headers be?
- What parameters are needed?
- Where should the report be placed in the VMS – the dashboard, the Report Menu (under which category)?
Business Questions – these questions focus on gathering basic information about your organization’s use of the report.
- Why is a new report being requested?
- What is the business driver for this report?
- What are you trying to achieve with this report?
- What type of decisions will this report help you make?
- How will the report be used?
- Who is the intended report audience?
- How often will the report be needed?
- Does the report need to be scheduled for release/publication?
- Does the data need to be limited or filtered?
- When should or shouldn’t an assignment, request, contractor, project, milestone, or timesheet display in the report?
- Are there any exceptions?
- How should the report content be sorted?
- How should the report content be grouped, for example, by Supplier, Labor Category, Cost Center, Manager, etc.?
♦ Definitions
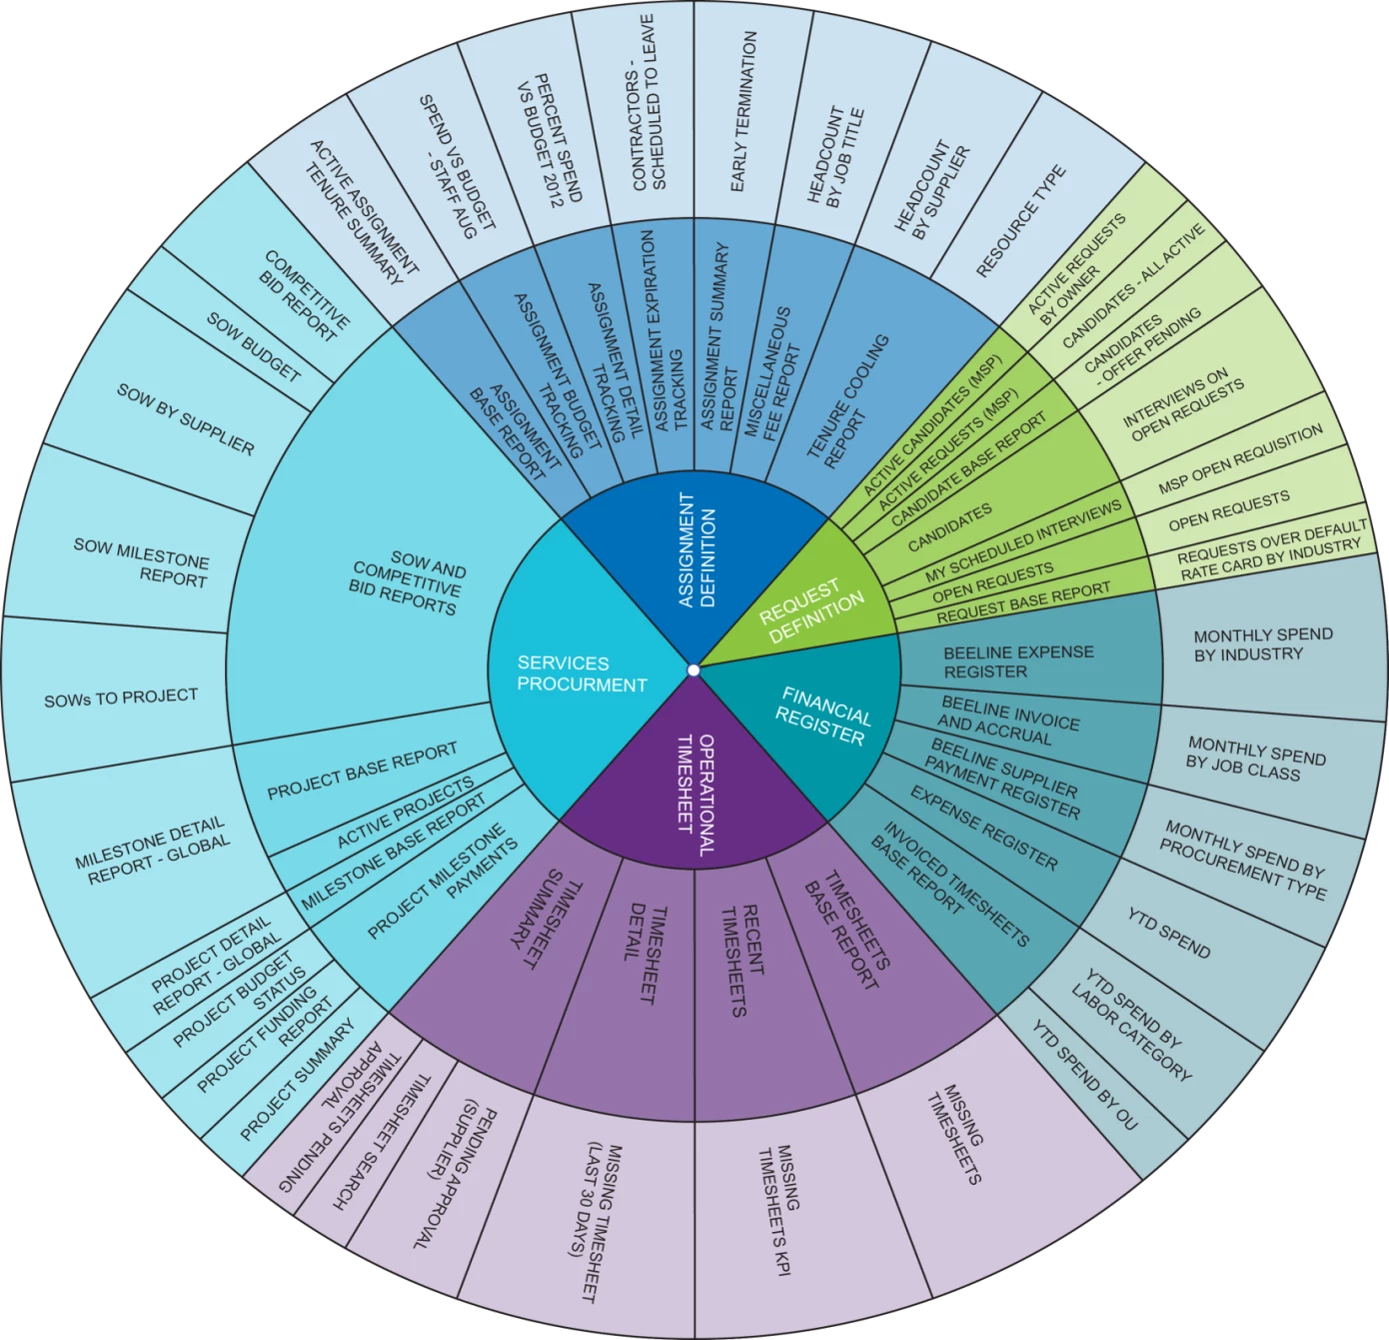
What are the report Definitions? Definitions are the root of Beeline Enterprise reporting. (See the Reporting Wheel diagram at the end of this article.) They list all the possible fields that can be incorporated into any Beeline Enterprise report broken down by subject category (for example, Request, Candidate, Assignment, Timesheets, etc.) However, ALL fields may not be relevant for a client’s usage, especially if they are not active users of all Beeline Enterprise solutions (for example, Contingent Staffing, Services Procurement, Resource Tracking.) We then use these Definitions to create base reports. The base report allows us to limit the fields we publish to the client's view making it much easier, and faster to build reports since the base reports only include fields that are relevant to the client.
| Base Report | Supplier Version? Y/N | Report Description |
| Request Base Report | Yes | Allows users to create a variety of requisition related reports including Request Pending Approval, Count of Open Requests, Count of Requests Released to Suppliers, etc. |
| Candidate Base Report | Yes | Allows users to create a variety of candidate related reports including Candidates Pending Interviews, DNR (Do Not Re-engage), Candidate Status, etc. |
| Assignment Base Report | Yes | Allows users to create a variety of assignment related reports including Headcount, Assignment Due to Expire, Tenure Tracking, etc. |
| Timesheets Base Report | Yes | Allows users to create a variety of timesheets related reports including Missing Timesheets, Timesheets Pending Approval, Timesheet Summary, etc. |
| Invoiced Timesheets Base Report | Yes | Allows users to create a variety of financial reports including Spend by Labor Category, Annual Spend Report, Overtime Spend, Spend by Hiring Manager, etc. |
| Expense Base Report | Yes | Allows users to create a variety of expense related reports including Expenses by Status, Expenses by Cost Center, Contractor Monthly Expenses, etc. |
| Combined Spend Base Report | No | Allows users to create financial reports combining time and material and milestones. NOTE: Clients must have an active Services Procurement module in order to report on milestones. |
| BTE Projects Base Report | No | Allows users to create a variety of BTE (Beeline Time & Expense) Project related reports including Active BTE Projects, Project w/ Task, Projects w/ Resources, etc. |
How to run a Standard Report
To run a standard report within Beeline Enterprise, you first need to select the report from the Report Gallery.
- Navigate to the Report Gallery and locate the tile for the standard report you want to run.
- Click Run (bottom left corner of the tile). The Create Report screen displays.
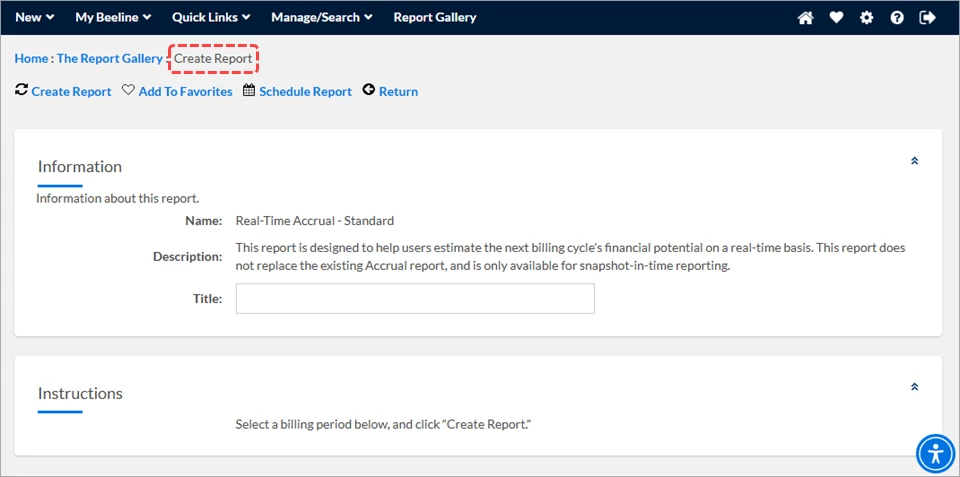
Optional: Enter an alternate Title of your choice.
- READ and follow the advisories posted in the Instructions section.
- Use the filters in the Parameters section to modify the report or leave the parameters blank to pull all the data to which you have access. Required fields are indicated by an asterisk (*). The report will not pull any data if the required fields are left blank.
- Click Create Report to run the report. (TIP: If you prefer to schedule the report to run at a different time, you will need to follow the instructions in the Scheduling and Emailing Ad hoc Reports article.
How to adjust and run a Base (Ad hoc) Report
Since Base Reports are templates, they need to be built before they can be run. Report Builder is the tool you will use to do this.
- Navigate to the Report Gallery and locate the tile for the base (ad hoc) report you want to run. (TIP: Report tiles with a “Base Ad hoc” label are base reports.)
- Click Run (bottom left corner of the tile). The Report Builder screen displays.
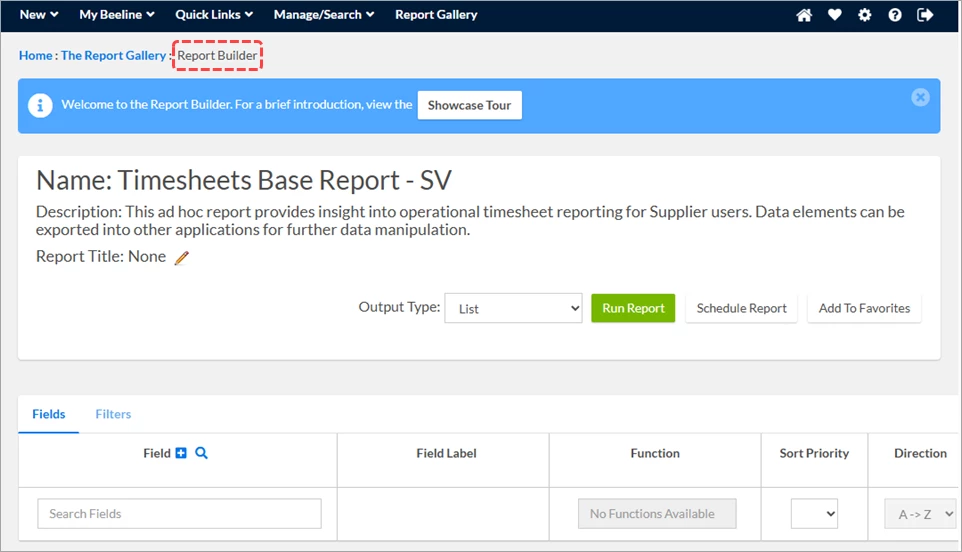
(TIP: For insights on how to use the Report Builder, view the showcase tour.)

- Information section: The information section displays the generic report name, a brief description of the report, and the ability to add your own Report Title by clicking the pencil icon.
-
Output Type: Select the desired output format for the report from the selection list. Output Type determines how the final report will be formatted. (See Appendix section for the list of options.)
-
Fields: Use the Fields section to select the desired field(s) to include in your report. You can search for a field by typing the name in the search box or you can do an advanced search by clicking the magnifying glass icon. The fields you select is the data that will appear in your report.

NOTE: The PREVIEW section at the bottom of the screen will begin to populate as you add fields.
-
Organizing the Fields: Report fields can be configured in a variety of ways to enhance how they are displayed on the final report. Configuration options include the ability to rename each field label, to set the alignment of the report data within each column, and to designate the sort order and manner of sorting for each field. Additional configuration options are available based on the selected output option for the report.
♦ Field Label – to edit the column name, click the pencil icon. This allows you to enter the label of your choice as the column name.
♦ Sort Priority – use this to select the field by which you want to sort your data. If sorting, you can also then select an ascending or descending order.
♦ Options – use this to select how to group and align your data. To make selections, click the wrench icon for the field you want to organize.
♦ Reordering columns – to reorder the way the columns appear in the report, simply drag and place the field in the position where you want it to appear.
♦ Remove data – if a column of data is not needed, simply click the X for the field you want to remove from the report.
♦ Functions - Functions are variables, usually numeric or date/time related that when combined, create a new calculated field. Not all functions will be available for each field. You can find a full function description by hovering over the question mark icon. To add a function, click the Search Function box and select a function from the list. For a description of the standard functions, refer to the Report Functions in the Appendix section -
Optional Filters - Filters allow a user to limit the data returned on a report. Multiple filters can be combined with Boolean operators, such as ‘and’ and ‘or’ to create complex queries.
♦ To add filters, Click the Filters tab. Here you can search for a field to filter by, by typing the name in the search box, or doing an advanced search using the magnifying glass. Data can be filtered by any available field.
♦ Select the Operator drop-down arrow and select an operator from the list that defines the condition.
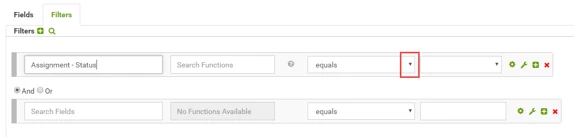
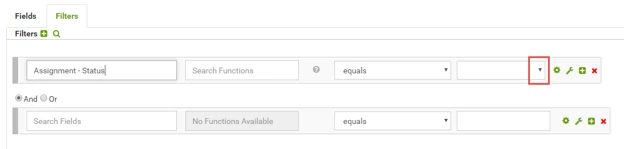
♦ Select the data you want to appear in the report based on the field and operator. Filters can also be combined with another filter by clicking the “And” or “Or” option.
-
Optional –Drill Levels - Drill levels are typically used when looking to start with a high-level overview and then drill in deeper for specific information. Drill levels represent the data that is returned in the second (drill-down) layer of reporting and contains a second list of fields. In order for the application to generate this second (drill-down) layer of data, an aggregate function must be selected and added in the Fields section of the screen. If a drill level appears, you can select all fields you want to see once you drill into the data.
NOTE: Not all output types support drill levels.
-
Run Report: Once your report is customized to the way you would like, click Run Report.

-
Add to Favorites or Schedule: - Once your report is created, you can then add the report as a Favorite or schedule it to be automatically emailed to you or the individuals of your choice.
• Add to Favorites: use when you may want to run the report on a sporadic basis.
• Schedule Report: use when you want this run on a set schedule.
• Click the appropriate option and follow the instructions.
TIP: Detailed instructions for scheduling reports can be found in the Scheduling and Emailing Ad hoc Reports article.
Appendix
Output Types (Base Reports)
- List - The report data displays as a list on a new screen within Beeline Enterprise.
- Excel - The report data displays in a new Microsoft Excel workbook.
- Form View - This option is used for building form reports or form screens. This Output option takes all fields and pivots them down to display each record in a separate form view.
- HTML - The report data displays in a new window as a Web page with no paging options.
- Chart - The report data displays in a chart format. There are a number of report options available to customize the appearance of the report.
- Formatted Report - The report data is displayed in a predefined template selected by the user. Through formatted report templates, clients can produce reports with customization, as well as groupings of report data. There are a number of report options available to customize the appearance of the report. Once created, Formatted Reports include features such as, Page Forward/Back, Zoom, Text Find, Export, and Print.
Functions (Base Reports)
- Count – Count the number of occurrences
- Distinct Count – Displays distinct count of occurrences
- Left Pad – Left pads the field with a character to a fixed length
- Left Trim – Trims the field to the length given (for example – 00001234 with a left trim of 4 would now read – 1234)
- Max – Displays the maximum value of the field
- Min – Displays the minimum value of the field
- Rank – Ranks the fields into Groups
- Right Pad – Right pads the field with a character to a fixed length
- Right Trim – Right trims the field to a given length
- Static Value – Static Value field
- Substring – Splits the field’s data from a start position to a length
Reporting Wheel:
Starting in the middle, locate the category of report you seek, then check the middle and outer rings to identify the specific reports related to that category.
| Persona | Module | Date Updated | Feedback? Email us: |
| PMO/VMO/MSP Users | Report Builder | Beeline Enterprise |